When is the Cheapest Time of Year to Buy a House?

Location, location, location – a term you’ve heard countless times for real estate and marketing strategies alike. While location is the single most important factor when it comes to buying a home, it’s usually one of the few factors in home buying that potential buyers consider. What if you were told that all other factors aside – even if it’s that perfect home you want in that expensive location you’ve been dreaming of for years – that waiting just a few months can make a huge impact on price?

While the warmer months of the year seem like the more appealing time to tour houses with your real estate agent, that’s exactly why it’s more expensive during that time. The winter – specifically October through March – usually hosts the lowest prices for home buyers. Of these winter months, the peak time for low prices is January and February, according to Trulia. Homeowners are in a rush to sell houses that have been lingering in the market, resulting in price drops, whether small or large.

When is the worst time of year for prices?

The summertime is generally the worst time of year for homebuyers in regard to price, meaning that prices in the summer are much higher. It mainly comes down to how long the house sits on the market. The longer the house sits on the market, the lower the cost of the house is at closing. The problem with the summertime – beginning with June – is that the turnaround for houses on the market is pretty high. Houses go on the market, and they are purchased fairly quickly in comparison to rates for other months of the year. This shortens the time for price negotiation.

What if you want a wider range of homes to choose from?

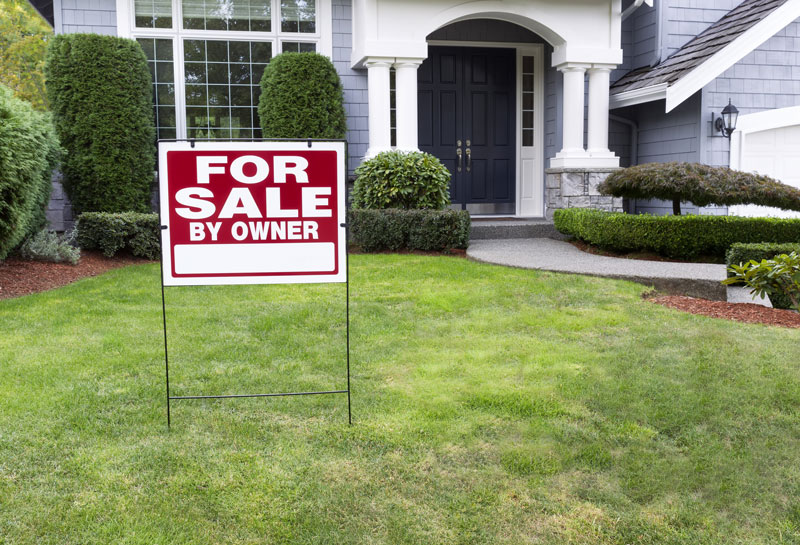
If price isn’t the most important factor to you, consider looking for homes in the spring. The housing market in April and May begins to flood, as people are ready to put their homes on the market and you see so many “for sale” signs post-Easter. If you’re prepared for a little less wiggle-room when it comes to price negotiation, but you’re looking at a highly specific set of criteria, spring is the best time for you to look for that perfect home.

How about a middle ground for prices and options?

Lucky for you, a middle ground does exist for these cycles between low prices and more options. This middle ground is the end of summer – towards July or August, once a large percentage of the homes listed in the spring and summer have sold, but the market is still more abundant than in the winter.

In summary,

  • If your priority is low prices…start looking in the fall, expecting to buy in the winter.
  • If your priority is a variety of homes to look at…start looking in the spring, expecting to buy in the summer.
  • If you want an equal balance of price and variety, start looking at the beginning of summer, expect to buy at the end of summer, before the beginning of fall.

House for Sale St. George

Riverside Cliffs Move-in Ready Home

Looking for a new home in St. George. This home is ready to move in. No need to wait for your home to be built or go through the hassle of buying a used home.

This Move-in Ready home is 1968 sq. ft. 4 bed, 2 bath with 2 car garage. Please call Richard for more information at 435-216-1707.


Buying Beats Renting

by Carla Hill

Are you staying put for at least three years? Savvy financial experts recommend you buy versus rent!

A new analysis by Zillow, a real estate information marketplace, providing vital information about homes, real estate listings and mortgages, reveals that the “break-even horizon” in more than 200 metros and 7,500 U.S. cities is three years (or less!). This is great news for wary buyers who have been fearful of declining home values in many cities.

These hard-hit cities are making a come back. The report found that in some of these areas the break-even horizon was less than two years!

“Across most of the country, historic levels of affordability make buying a home a better decision than ever, especially considering rents have risen more than 5 percent over the past year,” said Stan Humphries, Zillow Chief Economist. “This is the first analysis of metros and cities that presents the buy versus rent decision in an intuitive way, by telling consumers how long they must live in the home before buying breaks even with renting financially. It’s much more understandable, and therefore useful, than the abstract notion of a simple ratio of prices to rents. If we want consumers to act on market information, we have to align it with how they think about the issue and make it straight-forward to grasp.”

This analysis took into account the full picture of homeownership: downpayment, mortgage, transaction costs, property taxes, utilities, maintenance, tax deductions, and adjustments for inflation and forecasted home values. It also figured rental payments, utilities, and rental price appreciation.

This sunny outlook is not the case in all areas, however. A local real estate professional should be able to tell you the course of your local market and whether or not home values are once again on the rise. There may even be differences from one local community to the next. For example, in Mill Valley, Calif., just north of San Francisco, a homeowner can break even after 8.8 years, while in similarly-priced Menlo Park, south of the city, they must live in the home for 14.1 years.

It all depends on the area. The Miami-Ft. Lauderdale metro is among the most favorable for buying, with homeowners breaking even after only 1.6 years of living in the home.  However, in the San Jose metro, where home values are among the highest in the nation, a buyer must commit to living in their home for 8.3 years before they will break even.

Zillow reports “Metros where it takes more than five years to reach the breakeven point accounted for 7 percent of the 224 metros covered by the report. The metros with the longest breakeven horizons are San Jose, Calif. (8.3 years), Oak Harbor, Wash. (7.2 years), Santa Cruz, Calif. (7.1 years), San Luis Obispo, Calif. (6.3 years) and Salinas, Calif. (6.3 years). The metros with the shortest breakeven horizon are Memphis, Tenn., Miami-Ft. Lauderdale, Fla., Salisbury, Md., Red Bluff, Calif., Mobile, Ala., Tampa, Fla. and Fernley, Nev. (all tied at 1.6 years).”

Published: September 27, 2012

http://realtytimes.com/rtpages/20120927_buyingvsrenting.htm

Tips to begin the search for your new home

House hunting is never an easy task. But going into this process with a game plan can help you out tremendously. Here are great tips to help you begin the search for your homes for sale in St. George, UT.

  1. Make a list of your wants and needs. This includes everything from the number of bedrooms and bathrooms, square footage, floorplan layout and features.
  2. Research and review your desired area (school district, shopping centers, commute to your job and crime in the area). This will help you get a better feel of where you’ll be living.
  3. Know your financial situation ahead of time. There is nothing worse than falling in love with a home you can’t afford.  Contact a lender to see how much you qualify for and get pre-approved for a loan.
  4. Just because you qualify for a certain amount doesn’t mean you have to spend that much.
  5. Save your money to put down a larger down payment on your homes for sale in St. George, UT, pay closing costs and to furnish your new home.
  6. The homes you’ve viewed may start to blend together after viewing many properties. Document this process by taking notes and snapping pictures to remember the specific features of each home.
  7. Patience is key. This process may take some time, but never lose sight of your end goal.
  8. Don’t rush into buying your homes for sale in St. George, UT. This is a big deal and major investment so remember, don’t settle.

St. George MSA Added to 101 Improving Markets Index for April

EMBARGOED FOR RELEASE
UNTIL 10:00 A.M., ET, THURSDAY, APRIL 5
CONTACT: Paul Lopez
202-266-8409
plopez@nahb.org
www.nahb.org

101 HOUSING MARKETS ON IMPROVING LIST IN APRIL

WASHINGTON, April 5 – The list of housing markets showing measurable improvement expanded slightly to include 101 metropolitan areas in April, according to the National Association of Home Builders/First American Improving Markets Index (IMI), released today. Thirty-five states (including theDistrict of Columbia) are now represented by at least one market on the list.

The index identifies metropolitan areas that have shown improvement from their respective troughs in housing permits, employment and house prices for at least six consecutive months. The 101 markets on the April IMI represent a net gain of two from March, with 13 metros being added and 11 markets slipping from the list while 88 markets retained their places on it. Among the new entrants, areas as diverse asRome,Ga.;Coeur d’Alene,Idaho;Greenville,N.C.;Brownsville,Texas;St. George,Utah; andHuntington,W.Va., are now represented on the IMI.

“While housing markets across the country continue to struggle under the weight of overly tight lending conditions and other challenges, the April IMI indicates that just over 100 individual metros are showing measurable and consistent signs that they are headed in the right direction,” said NAHB Chairman Barry Rutenberg. “A total of 34 states and theDistrict of Columbiaare now represented on the list, with 10 states having four or more entries. This positive news is in line with what our builder members have observed regarding firming conditions and improved buyer interest in certain locations.”

“After five consecutive months of gains, the IMI recently began to plateau, with many markets holding steady and a few experiencing the ups-and-downs that are typical in a choppy recovery,” observed NAHB Chief Economist David Crowe. “The IMI is designed to highlight markets that are showing consistent improvement, and those markets that have registered the smallest gains are more susceptible to dropping off the list due to a minor setback in prices, permits or employment,” he explained. “At the same time, as stronger markets approach stability, it will get harder for them to keep charting improvement, which will also limit the expansion of the IMI.”

“The fact that the number and geographic distribution of improving housing markets continued to expand beyond the 100 mark in April bodes well for the start of the spring home buying season, and should be an encouraging sign for those who are considering a home purchase,” added Kurt Pfotenhauer, vice chairman of First American Title Insurance Company.

The IMI is designed to track housing markets throughout the country that are showing signs of improving economic health. The index measures three sets of independent monthly data to get a mark on the top improving Metropolitan Statistical Areas. The three indicators that are analyzed are employment growth from the Bureau of Labor Statistics, house price appreciation from Freddie Mac, and single-family housing permit growth from the U.S. Census Bureau. NAHB uses the latest available data from these sources to generate a list of improving markets. A metropolitan area must see improvement in all three areas for at least six months following their respective troughs before being included on the improving markets list.

A complete list of all 101 metropolitan areas currently on the IMI, and separate breakouts of metros newly added to or dropped from the list in April, is available at: www.nahb.org/imi.


APRIL IMPROVING MARKETS
NEW MSAs – April
CA Fresno
GA Rome
IA Sioux City
ID Boise
ID Coeur d’Alene
MD Hagerstown
NC Greenville
NY Buffalo
NY Utica
PA Lancaster
TX Brownsville
UT St. George
WV Huntington

Sustained MSAs – April

AR Little Rock
CA Merced
CO Boulder
CO Denver
CO Fort Collins
CO Greeley
CT New Haven
DC Washington
FL Crestview
FL Orlando
FL Panama City
FL Cape Coral
FL Deltona
FL Jacksonville
FL NorthPort
FL Punta Gorda
FL Tampa
IA Iowa City
IA Ames
IA Des Moines
IA Dubuque
IA Waterloo
IN Evansville
IN Elkhart
IN Indianapolis
IN Lafayette
KY Louisville
LA Lake Charles
LA Monroe
MD Cumberland
ME Lewiston
MI Flint
MI Saginaw
MI Detroit
MI Grand Rapids
MI Lansing
MI Monroe
MI Muskegon
MN Minneapolis
MO Columbia
MO Jefferson City
MO Joplin
MO Kansas City
MS Jackson
NC Burlington
NC Charlotte
NC Goldsboro
NC Greensboro
NC Rocky Mount
NC Winston-Salem
ND Bismarck
ND Fargo
ND Grand Forks
NE Lincoln
NJ OceanCity
NY Glens Falls
NY Rochester
OH Columbus
OH Dayton
OH Springfield
OK Tulsa
OR Corvallis
OR Portland
PA Altoona
PA Erie
PA Pittsburgh
PA Williamsport
SC Charleston
SC Spartanburg
SD Sioux Falls
TN Chattanooga
TN Kingsport
TN Nashville
TX San Antonio
TX Amarillo
TX College Station
TX Dallas
TX Laredo
TX Longview
TX McAllen
TX Midland
TX Odessa
TX Tyler
TX Victoria
UT Provo
VT Burlington
WY Casper
WY Cheyenne
 Editor’s Note: The NAHB/First American Improving Markets Index (IMI) is usually released on the fourth business day of each month at 10:00 a.m., ET, unless that day falls on a Friday – in which case, the index will be released on the following Monday. A full calendar of future release dates can be found at www.nahb.org/imi.     

St. George, UT in nation’s top 10 in growth!

By Lee Davidson

The SaltLakeTribune

Published: April 5, 2012 08:50AM
Updated: April 5, 2012 07:38AM
Francisco Kjolseth | The Salt Lake Tribune Adobe is building a new campus in northern Utah County just below Cabela’s and next to I-15 at the Lehi exit. March 12, 2012. Such projects are contributing to growth in the Provo-Orem metro area and inUtahCounty.

Provo-Orem,HeberCityand St. George — and, to a lesser extent,SaltLakeCounty— were among the fastest-growing places in the nation in 2011, according to new estimates from the U.S. Census Bureau.

But not everywhere inUtahis booming. Estimates also showed that rural Beaver, Carbon, Emery,Garfield, Piute andWaynecounties all lost population last year.

“It’s not that we are booming economically inUtah. But relative to other places, we are doing a little better — so that is attracting some people to come here for economic opportunity, or to stay here or move around in the state,” said state demographer Juliette Ten-nert. “Also, we have a lot of natural increase [more births than deaths]. We have a high fertility rate and a lot of women in childbearing years.”

The Census Bureau released 2011 population estimates on Thursday for counties, metropolitan areas and micropolitan areas (places between 10,000 and 50,000 population). Last December, it released 2011 estimates for states — which then said Utah was the second fastest-growing in the nation (behind Texas) with a 1.9 percent increase from 2010 to 2011, more than double the 0.9 percent average growth nationally.

New estimates show some areas ofUtahare surging even more.

TheHeberCitymicropolitan area, for example, grew by 3.8 percent — or four times faster than the national rate. That made Heber the seventh fastest-growing such area in the nation.

Meanwhile, the Provo-Orem metropolitan area grew by 2.7 percent, or three times the national average. It also finished as the nation’s seventh fastest-growing metropolitan area.

Metro St. George landed at No. 11 out of 366 metropolitan areas nationally with 2.6 percent growth.MetroSaltLakeCity was No. 40 at 1.9 percent.Loganwas No. 64 at 1.7 percent. Ogden-Clearfield was No. 77 at 1.6 percent.

Among counties with at least 10,000 population, Wasatch was the 29th fastest-growing in the nation (at 3.8 percent) andSummitwas No. 36 (at 3.5 percent). By numeric jump,SaltLakeCountywas No. 32 in the nation (adding an estimated 19,300 people in the year) andUtahCountywas No. 49 (adding nearly 14,000).

Even with its relatively quick growth,SaltLakeCountydropped from the nation’s 38th most populous county to No. 39 — surpassed by Travis County, Texas, home of the state capital ofAustin. (A chart showing new population estimates for all counties inUtahis online at sltrib.com.)

Heber City Manager Mark Anderson explained growth there, saying, “A lot of people here work inSummitorUtahcounties, but prefer to live here. It’s a little slower pace of life, with access to recreational activities and a high-quality lifestyle.”

Utah County Commissioner Larry Ellertson sees numerous reasons for the relatively high growth in his county.

“Several significant businesses have located here in the past year,” he said. “We also had a number of big construction projects that may have brought people here to find employment or kept some here who otherwise might have moved.”

Among businesses moving or expanding inUtahCounty, he said, were Microsoft and Adobe. Major construction projects include the Interstate 15 rebuild and the huge new National Security Agency computer center nearCampWilliams.

“We are also looking forward to some more companies coming in the near future,” Ellertson said, “but they are not yet ready to announce their plans.”

The commissioner also notes thatUtahCountyhas among the highest fertility rates in the nation, so most of its growth comes from births.

Pam Perlich, senior research economist at theUniversityofUtah, said helping accelerate that trend was the recent conversion ofUtahValleyUniversityinto a full university, attracting more students — many of whom marry and have children. Along withBrighamYoungUniversity, she said, that shift creates an especially high birthrate.

Growth in St. George was perhaps the most surprising and welcome.

“The recession had been worse here than in other parts ofUtah,” said Lecia Langston, regional economist in St. George for the Utah Department of Workforce Services. “The boom was bigger here because of the housing market, and the bust was bigger, too. It’s good to see it turning around now, but I guess that’s easier to do once you hit rock bottom.”

During the decade between 2000 and 2010, St. George was the second-fastest growing metro area in the nation. The Census Bureau noted that other areas of fast growth in the previous decade have slowed dramatically as their booming housing markets collapsed.

For example,Palm Coast,Fla., fell from the No. 1 fastest-growing metro area to No. 55. AndLas Vegasplunged from No. 3 to No. 155. St. George remained fairly high, slipping from No. 2 to No. 11.

The areas that lost population inUtahwere all rural. The Census Bureau estimated that they all had natural increase (more births than deaths), but lost population due to people leaving — likely to find work.

PiuteCountyhad the biggest drop by percentage, 3.8 percent; followed byWayne, 1.5 percent; Beaver andGarfield, 0.5 percent; Carbon, 0.4 percent; and Emery, 0.3 percent.

ldavidson@sltrib.com


Ence’s Simple Home Buying Process

You’ve been thinking about buying a new home. Now is the time to stop thinking about purchasing that home and taking the necessary steps to own a Southern Utah homes for sale. With Ence Homes the process is easy.The first step is to connect with an Ence Representative who will introduce you to the various floorplans you can choose from. Once you pick your floorplan it is time to secure your loan and sign a purchase agreement. An Ence Representative will assist you during this process and they’ll be with you from concept to completion of your project.

The next step is to customize your home to select all the right features for your Southern Utah homes for sale with the help of the Ence Homes Design Center.

Once you have your homes design locked down it’s time to build your home. From there a community specialist and project manager will keep you in the know of the home building process. They’ll be on standby to answer any questions you may have and will send pictures to update you on the various stages of building.

After your home is complete it’s time to close on your home and get ready to move into your new home. A Homeowner Orientation meeting is available to acquaint you with the ins and outs of your home from warranty coverage to maintenance. You’ll sign the title papers and get the finances transferred during a closing appointment. Finally, keys will be handed over to make you the official homeowner.

As you can tell Ence’s home buying process is simple. So, contact a Representative to get started on your Southern Utah homes for sale today.

Now is a Great Time To Buy

With a population of 138,492, picturesque views, walking trails, pools, plenty of golfing, low crime rates, an excellent school district and just a thirty-minute drive to the Zion National Park, St. George, UT is a fabulous place to live and raise a family. Over the next two years, the housing market is expected to turn around for your home in St. George, UT neighborhoods. This projected bounce back makes now a great time to buy a home.Now is the ideal time to purchase or custom make a home because as the market recovers, there’s an anticipation of a rise in property value. Prices of your home in St. George, UT are expected to increase 7.9% from the second quarter of 2011 to the second quarter of 2012. Right now mortgage rates are also seeing historic lows. This is great news for prospective Ence Homes customers of the St. George, UT neighborhoods who are looking for a reason to buy. Buying a home is also more economically beneficial than renting and the unemployment rate is currently at 9.6%, which dropped from the 10.6% it was back in January 2010

The housing market recovery means excellent opportunities for you and your family by buying home in St. George, UT. Consult the Ence Homes to schedule a tour of one of their move-in ready homes or to build your home